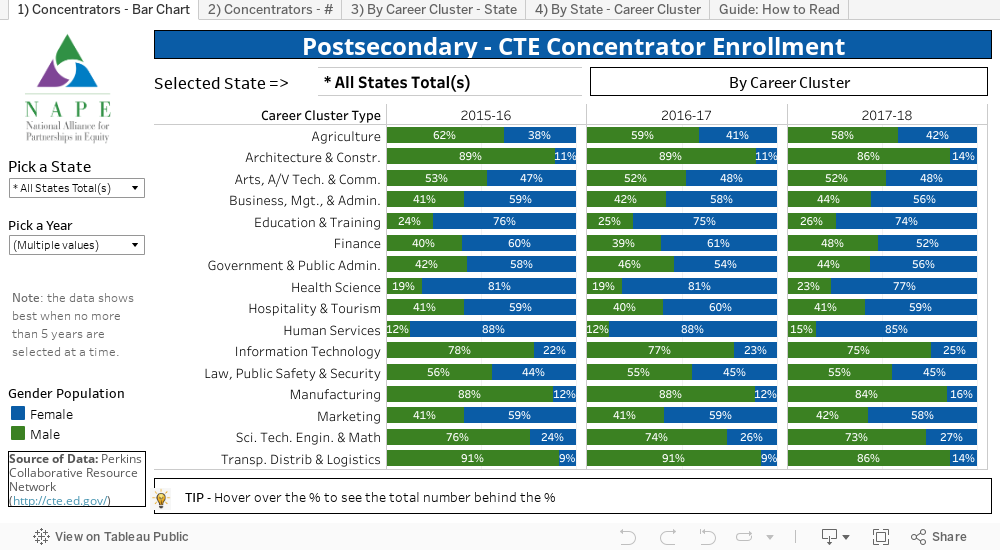
Career Clusters by Gender: Postsecondary
How to Read this Dashboard:
What is a Postsecondary Concentrator: A postsecondary student who: (1) completes at least 12 academic or CTE credits within a single program area sequence that is comprised of 12 or more academic and technical credits and terminates in the award of an industry-recognized credential, a certificate, or a degree; or (2) completes a short-term CTE program sequence of less than 12 credit units that terminates in an industry-recognized credential, a certificate, or a degree.This dashboard has 4 tabs representing Postsecondary data: Tab 1 – Concentrator Bar Chart – this shows the 16 various career clusters and the percent breakdown represented by a bar graph by gender. Select the state and the years you want to view. It is defaulted to show the past 3 years. Hover over the % showing to view the raw data. Tab 2 – Concentrator # – this shows the 16 various career clusters and the percent breakdown by gender (just the raw numbers but no bar graph). Select the state and the years you want to look view. It is defaulted to show the past 3 years. Hover over the number showing to view the percent breakdown. Tab 3 – By Career Cluster Within State – this shows the participation by career cluster by gender for each state. All the percentages will equal 100%. This is a great way to view which career cluster is most popular within a gender and state. Pick each year you want to view. Tab 4 – By State Within Career Cluster – this allows you to select a career cluster and then see a breakdown by state. This is comparing all the states numbers to each other. Pick the year you want to view.