Career Clusters by Gender: Secondary
How to Read this Dashboard
What is a Secondary Concentrator: A secondary student who has earned three (3) or more credits in a single CTE program area (e.g., health care or business services), or two (2) credits in a single CTE program area, but only in those program areas where 2 credit sequences at the secondary level are recognized by the State and/or its local eligible recipients.
This dashboard has 4 tabs representing Secondary data:
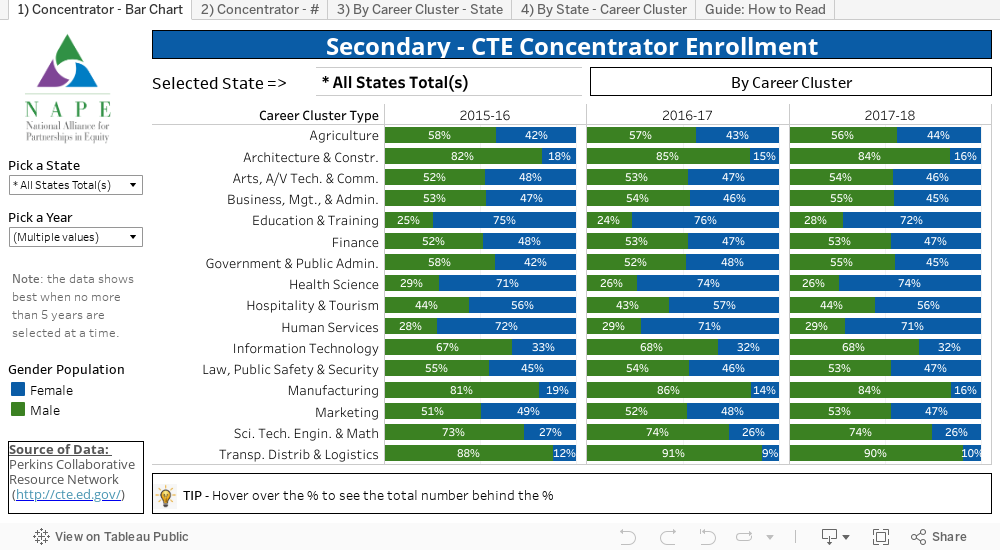
Tab 1 – Concentrator Bar Chart – this shows the 16 various career clusters and the percent breakdown represented by a bar graph by gender. Select the state and the years you want to view. It is defaulted to show the past 3 years. Hover over the % showing to view the raw data.
Tab 2 – Concentrator # – this shows the 16 various career clusters and the percent breakdown by gender (just the raw numbers but no bar graph). Select the state and the years you want to look view. It is defaulted to show the past 3 years. Hover over the number showing to view the percent breakdown.
Tab 3 – By Career Cluster Within State – this shows the participation by career cluster by gender for each state. All the percentages will equal 100%. This is a great way to view which cluster is most popular within a gender and state. Pick each year you want to view.
Tab 4 – By State Within Career Cluster – this allows you to select a career cluster and then see a breakdown by state. This is comparing all the states numbers to each other. Pick the year you want to view.